GOAL: Forward console research (command and output) into notes to reduce report write-up time.
D - Follow-up
2024Feb05: I decided I didn’t like the below append function enough that I asked StackOverflow what to do & their response was much better than what I had below. Now the much simpler code stores the info within the directory ran to a file called SUM (but should only be ran for code which has a consistent output if ran twice).
So my dotfiles now reads:
function stash {
  cmd="$(history -- -2 | head -n1 | cut -c8-)"
  FILE='./SUM'
  echo $cmd >> $FILE && eval $cmd >> $FILE && echo "  " >> $FILE
}

function save {
  stash
}
20220627:
A - Lab
1. code
Note: This is more complex than your normal google results of “add output to file” because we want to also capture the generating command.
Preferably, you’ll add the following into your .bash_profile or bash
dotfiles to be able to access this append command from any session.
### to use
# 1. execute random command
# 2. run: append "!!"
#    - will capture very last within session
#    - !! must be in quotes to parse bash pipes, etc
#
function append {
  if [[ -z $NOTE ]]; then
    echo "👻 not saved; set NOTE & repeat"
  else
    input="$*"
    FILEa='/Users/stef/downloads'/$NOTE'.md'

    echo >> $FILEa
    echo "\`\`\`" >> $FILEa
    echo "$ #" $(date +%Y%m%d-%H%M%S) >> $FILEa
    echo "$ "$input >> $FILEa
    echo "$(eval $input)" >> $FILEa
    echo "\`\`\`" >> $FILEa
  fi
}
This is purposely written to respect Bash piping (allows you to use jq,
grep, etc) while maintaining output formatting when it appends into
file.
2. run
If you added to dotfiles, you can run append from any console Bash
session/directory. (May require restarting your console.)
Last login: Mon Jun 27 11:59:23 on ttys000
$ pwd
/Users/stef/Documents
$
$ NOTE="TMP"
$ echo "stef"
stef
$ append "!!"
append "echo "stef""
$
$ cd /Users/stef/Downloads
$ ls | grep TMP
TMP.md
3. result
The TMP.md (file was auto-created-as-needed and) appended
```
$ # 20220627-120212
$ echo stef
stef
```
As a Mardown file, this will render
$ # 20220627-120212
$ echo stef
stef
B - Use Case
I use Obsidian for my notes which lets you wiki embed sub-Markdown-pages. I work on Elasticsearch Database Administration.
Elastic Cloud lets you maintain your “deployment” via their API. You can also capture a point-in-time cluster view via an Elasticsearch diagnostic.
1. ess api
You can setup your Bash dotfiles to quick cURL your ESS/ECE deployment’s ES API Console.
### to use
# 1. setup console variable: ELASTIC_ECE_KEY
# 2. run ess $DEPLOYMENT_ID $REQUEST_PATH
#
function ess {
  AUTH="Authorization: APIKey ${ELASTIC_ECE_KEY}"
  MGMNT="X-Management-Request: true"
  DOMAIN="https://adminconsole.found.no/api/v1/deployments/$1/elasticsearch/"
  optA="main-elasticsearch/"
  optB="elasticsearch/"
  URI_END="proxy/"

  if [[ -z "$2" ]]; then URI="/"; else URI=$2; fi
  if [[ URI != "/" ]]; then URI_END+=$2; fi
  response=$(curl -s -XGET -H "$AUTH" -H "$MGMNT" $DOMAIN$optA$URI_END)

  if [[ $response == *"resource_not_found"* ]]; then
    response=$(curl -s -XGET -H "$AUTH" -H "$MGMNT" $DOMAIN$optB$URI_END)
  fi
  echo $response
}
Your simplified deployment’s Elasticsearch cURL can now be ran in console, e.g.
$ ess e406cfd66dc944119bd8da2bb7290d2b _cluster/health?filter_path=status
{"status":"yellow"}
2. investigate
Let’s say I’ve received an alert that my cluster’s status:yellow.
JSON filtering done via JQ. I’ll
grab a diagnostic to capture my point-in-time situation. Then confirm:
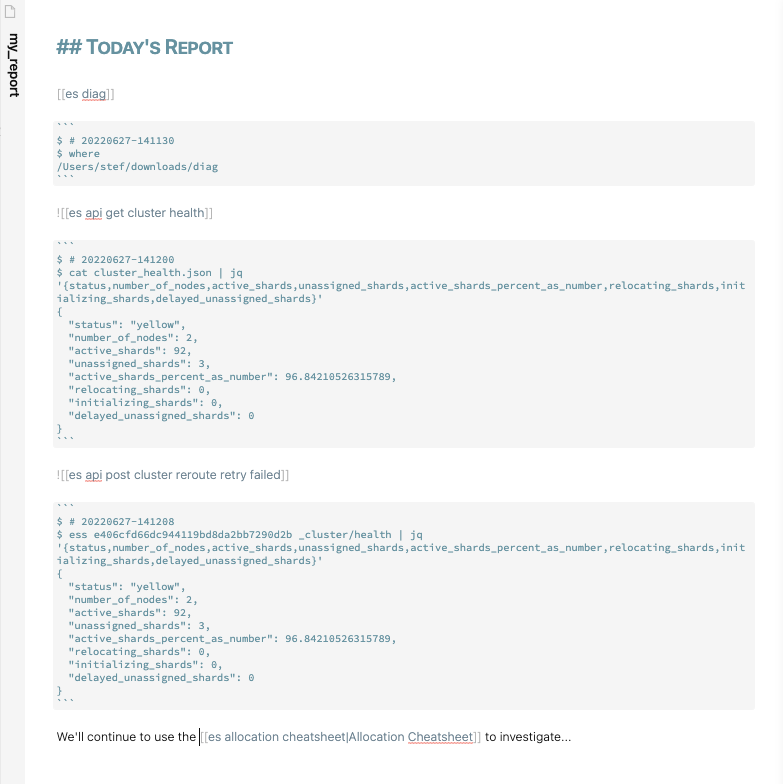
$ NOTE="my_report"
$ where
/Users/stef/downloads/diag
$ append "!!"
$ cat cluster_health.json | jq '.status'
"yellow"
My Allocation Cheatsheet suggests we need to check if we’re currently assigning/recovering shards.
$ cat cluster_health.json | jq '{status,number_of_nodes,active_shards,unassigned_shards,active_shards_percent_as_number,relocating_shards,initializing_shards,delayed_unassigned_shards}'
{
  "status": "yellow",
  "number_of_nodes": 2,
  "active_shards": 92,
  "unassigned_shards": 3,
  "active_shards_percent_as_number": 96.84210526315789,
  "relocating_shards": 0,
  "initializing_shards": 0,
  "delayed_unassigned_shards": 0
}
$ append "!!"
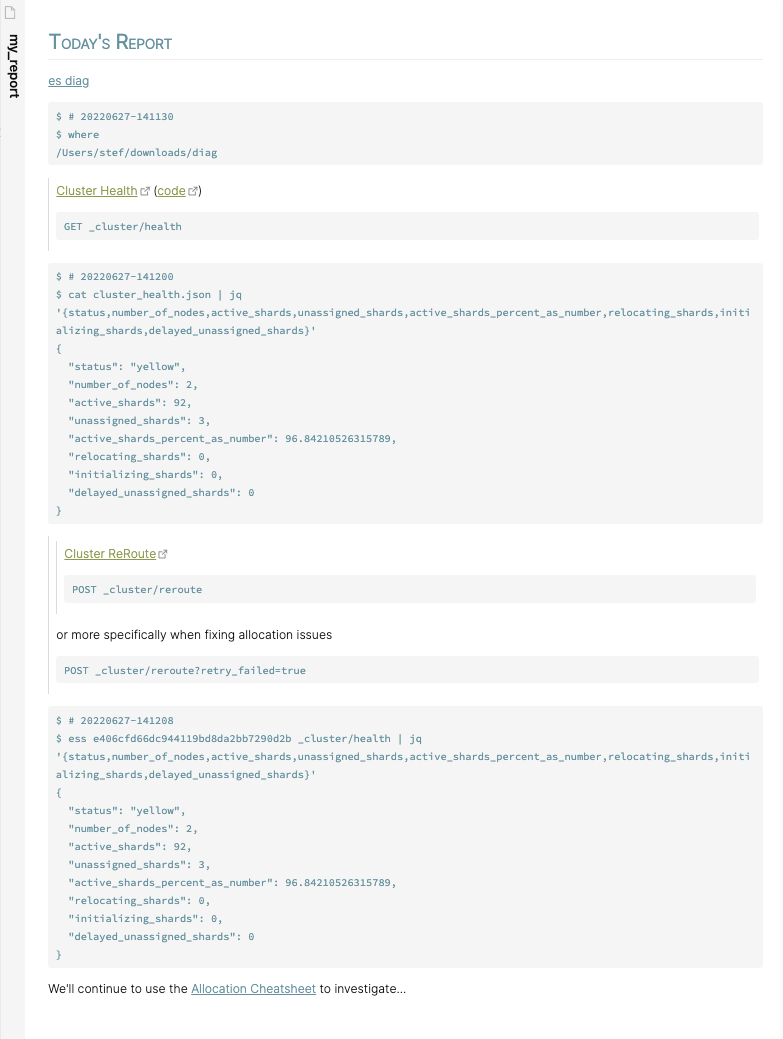
We are not, so following cheatsheet, we’ll kick off a
Cluster Reroute.
After 5min, I run ess to poll
Cluster Health.
$ ess e406cfd66dc944119bd8da2bb7290d2b _cluster/health | jq '{status,number_of_nodes,active_shards,unassigned_shards,active_shards_percent_as_number,relocating_shards,initializing_shards,delayed_unassigned_shards}'
{
  "status": "yellow",
  "number_of_nodes": 2,
  "active_shards": 92,
  "unassigned_shards": 3,
  "active_shards_percent_as_number": 96.84210526315789,
  "relocating_shards": 0,
  "initializing_shards": 0,
  "delayed_unassigned_shards": 0
}
$ append "!!"
We’re unchanged. This suggests a non-transient issue’s at play. We continue to use the cheatsheet and Elasticsearch docs to investigate.
Where Elasticsearch’s recovery and ILM processes can poll at <10min intervals, I frequently work with clients on transient issues. This is why my research=>report integration automatically tracks the time added.
For internal tracking, I usually leave the file in its raw format:

3. result
If a client is requesting an RCA, I’ll manually add in quotes (previously written notes summarizing various Elastic concepts) to flush out the why/how we progressed through our investigation:
This exports as a ready-to-go PDF.
Note: For an actual RCA, I’ll write-up an executive abstract at the top and flush out the stream-of-concious investigation below. The second part’s not required but helps me teach my clients to reduce their dependency on me.
C - Review
Happy so far. Future wants:
- LNAV (console log viewer) allows you to filter columns and not just rows which’d be very helpful for reports.
- Obsidian’s Local Rest API let’s you API query your notes which’d be helpful to automate diagnostic/log investigation to known issues.
- I’ve figured out how to use Python + Obsidian’s Excalidraw to transition visual diagrams into investigation paths. I need to figure out how to bring this into play to automate writing the report.